Different Types of Candles on a Candlestick Chart
Different Candlestick Types to Know
- Big Candles
- Dojis
- Gravestone / Dragonfly
- Shooting Star / Hammer
- Morning Doji Star / Evening Doji Star
- Bearish Harami / Bullish Harami
- Engulfing Bullish / Engulfing Bearish
Before we dive into each candlestick type, why would we even use a candlestick chart?
Candlestick charts can give you a variety of information if you understand patterns and trends. Using the knowledge of the different types of candlesticks can help you piece together patterns, which will lead to more successful and potentially profitable choices.
Why Not Use the Line Chart?
The line chart is the most basic and simplest chart available when reviewing the history of a stock. It displays a series of closing prices and connects them by a line that can be viewed by day, week, month, or year.
While this chart is simple and shows prices and patterns over time, the information it gives is quite limited. That is why most professional brokers and experienced traders will use candlestick charts instead of line charts.
In fact, every professional (and amateur) trader I know uses TradingView to keep track of their stocks- being the most extensive charting application online. The free version is great and allows for many functions for a beginner trader but a PRO plan will allow you multiple alerts and charts in one tab to keep a close eye on important movements in stocks.
The Candlestick Chart
The candlestick chart is the same as the line chart but includes much more detailed information on the pricing of the stock.
For example, let’s take a look at this line chart for Dell.
We can tell that in late November 2019, the price plummeted down from $56.21 to $47.03 but we want to know how it happened– which this chart does not tell us.
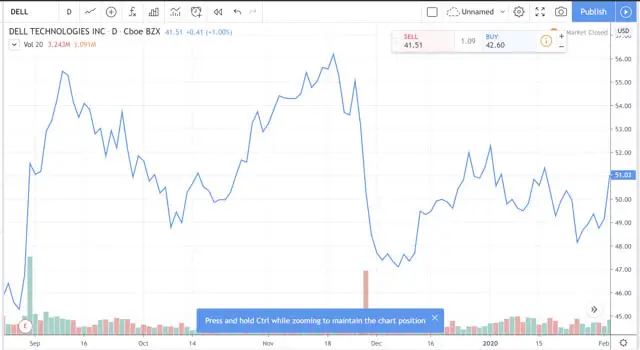
If we look at the same company with a candlestick chart, we can gain more valuable insight on what happened. For each day, we can determine the open price, close price, high price, and low price. In order to understand the candlestick chart, it is first good to understand the basic concept of a candlestick.
Candlesticks Explained
A candle shows the opening, closing, high, and low price for a certain time period. When a candle goes up in a time period, it is colored green and if it goes down, it is colored red. An example of this is given in the illustration below.
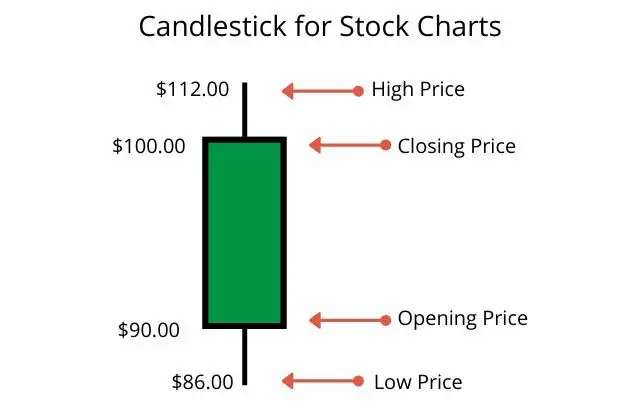
For this candle, the first trade of the day began at $90 (which is the opening price) and then moved around until the last trade of the day closed at $100. This was a $10 price increase which makes it a green candle.
Notice the lines above and below the main body of the candle. This is where the price fluctuated even though it did not open or close at those prices.
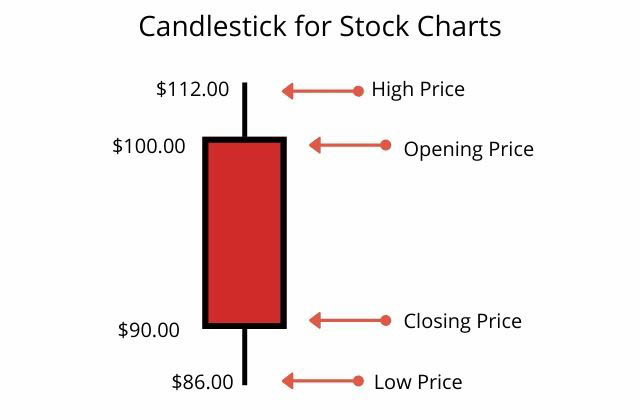
This example would be a candle with a decrease in price where the opening price began at $100 and closed at $90.
Candles do not have to be set at a specific span of time. They can be set to represent a single day, a whole month, or even as low as a single minute.
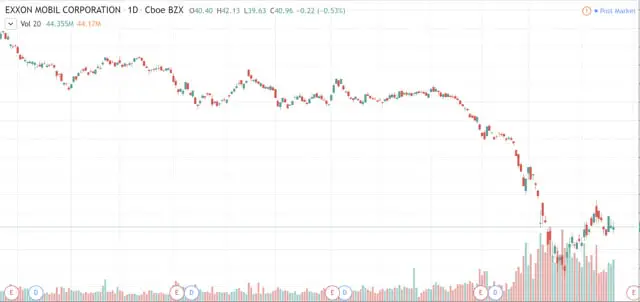
Here are the candles for different time spans for the company Exxon Mobil.
1-year chart with Candles by Day
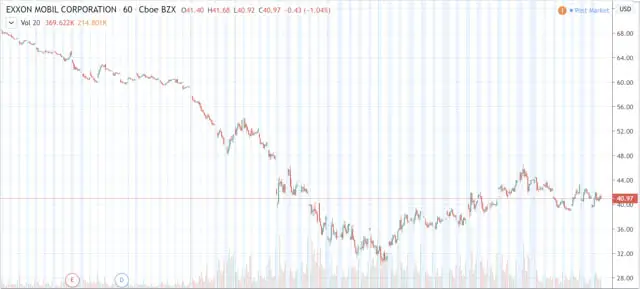
3-month chart with Candles by Hour
1-day chart with Candles by Minute
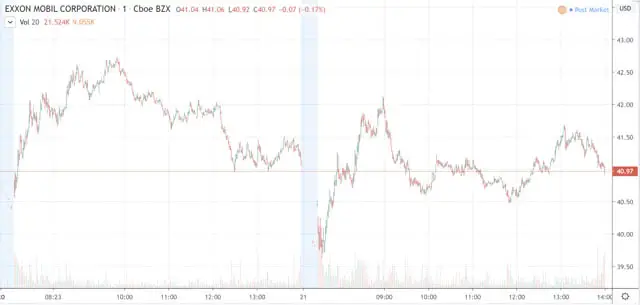
You will notice that the candles take on many different forms and sizes. Identifying different types of candles can help with spotting trends.
Ready to start trading stocks? Don’t make the rookie mistake of losing money by going in blind without a mentor. If you want to do it right, check out Timothy Sykes, the leading name in swing trading penny stocks.
Different Types of Candlesticks
- Big Candles
- Dojis
- Gravestone
- Dragonfly
- Shooting Star
- Hammer
- Morning Doji Star / Evening Doji Star
- Bearish Harami / Bullish Harami
- Engulfing Bullish / Engulfing Bearish
Let’s explore each type of candle and how it can help you predict patterns and trends.
Big Candles
Big Candles are self-explanatory since they are large candles with major price differences.

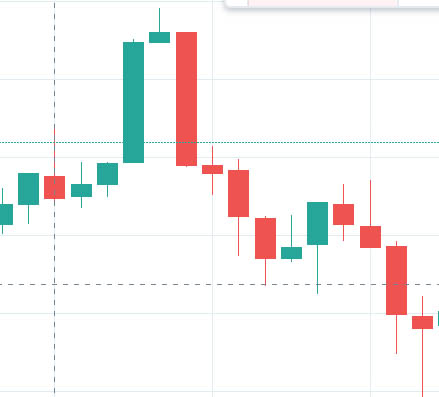
Here is a segment of a candlestick chart that has an example of a big candle compared to a small candle.
The small candle might have been a $0.20 drop in price where the big candle might have been a $2.00 drop in price. The important thing to note is that big candles are drastic changes in price whether it be increasing or decreasing.
A candle tells us about the current supply and demand during the lifespan of the candle. A big candlestick that decreases in price means that during that time, supply was much higher than demand. If the candle increases in price, then demand was higher than supply.
For example, this chart has an exceptionally large drop on this day and is marked by a big red candlestick.
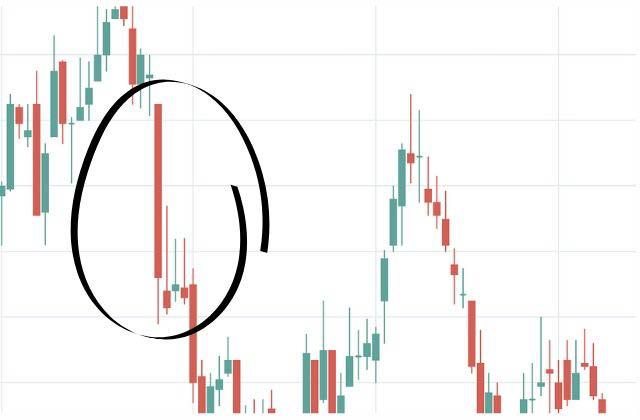
We know right away that supply was much higher than demand on this day- but why such a large drop?
We can assume that there might have been some news or information that caused such a drastic change in price. Let’s explore another candlestick form known as a Doji.
Dojis
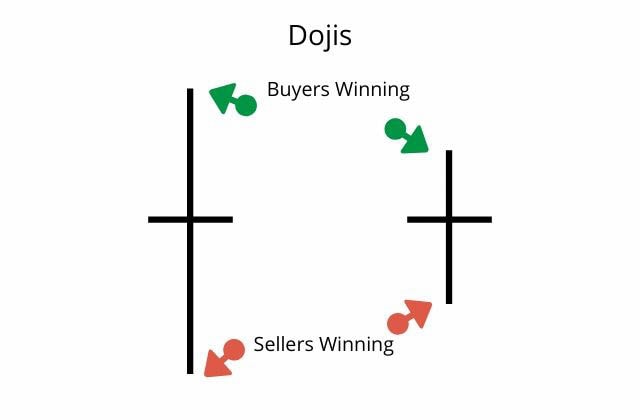
A doji is a candle that fluctuates in price during a certain period but opens and closes at the same price. The period could be 1 day, 1 hour, or even one minute. The synopsis is still the same- which is that there is uncertainty in the market.
At one point, buyers were winning and at one point sellers were winning but it ended up closing at the same price as when it opened. If the candle wick is large, then that simply means that there is higher indecision than a doji with a small wick.
Dojis by themselves tell us that there is indecision on the price but does not tell us much beyond that. Although, if using them with other candle stick patterns, you might be able to learn more about how the stock price is going to move. Two of patterns are the morning doji star and the evening doji star.
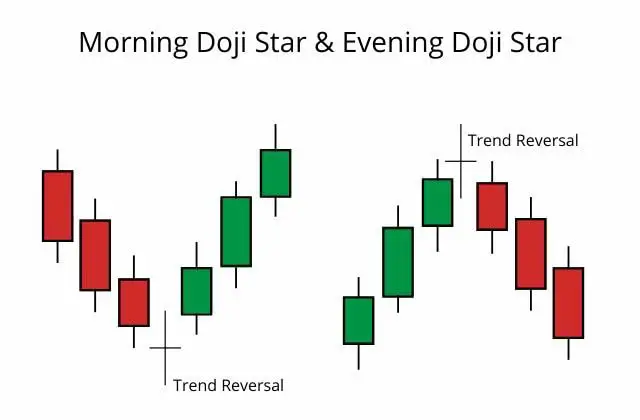
Morning Doji Star and Evening Doji Star
These patterns use the doji to mark a possible trend reversal. If the candles are moving down and then hit a doji and begin moving up, this would be an example of the morning doji star. The opposite pattern where the doji marks a trend reversal going down, then that would be an example of an evening doji star.
The morning and evening doji stars are not going to tell you what stocks you should purchase.
You should not simply see this pattern and rush to go purchase.
But, if you have already chosen a stock based on your strategy, this pattern will help tell you the best timing to enter the market.
Also, do not get caught up on searching for a doji that has an exact match with the opening and closing price. It could also have a small body with similar opening and closing prices. The point is to have the knowledge of being able to identify the pattern for market entry.

This is an example of a good time to enter the market. The small candle at the bottom is an indicator that the pattern is shifting and there is a trend reversal. It would likely be a good time to purchase after the stock bottomed out and showed promise for growth.
Gravestone and Dragonfly
These two forms of a candle are like the doji in that they open and close at the same price, but they only fluctuate in one direction: increasing or decreasing.
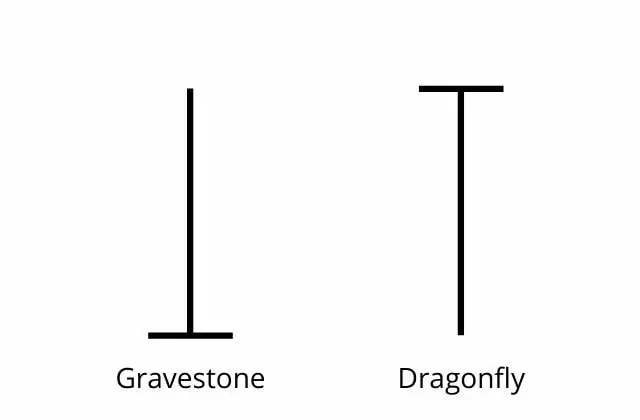
Similar to the doji, they will not be very helpful by themselves but using them with other candle forms can help predict the future of a stock.
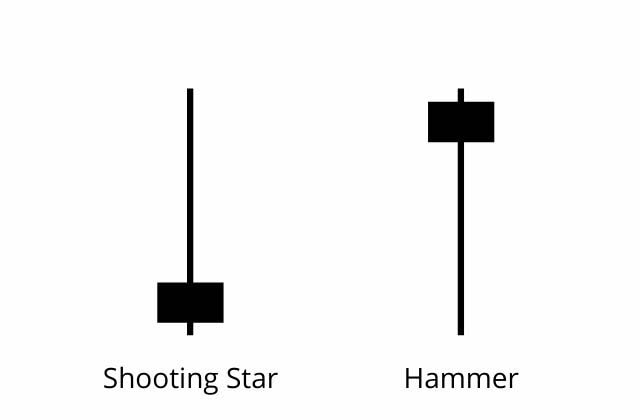
Shooting Star and Hammer
A shooting star is where the stock opens at a price and goes up and then goes down to close just above where it opened. It is almost identical to the gravestone but instead closes just above the opening price rather than closing at the same price.
The same goes for the hammer. The hammer is where the price opens and the goes down a bit and back up to close just below the opening price. This pattern is closely related to the dragonfly candle type.
Bearish Harami and Bullish Harami
These patterns consist of a large candle followed by a smaller candle that is contained within the body of the first candle. The bearish harami signals a reversal pattern to the downside while the bullish harami signals to the upside.
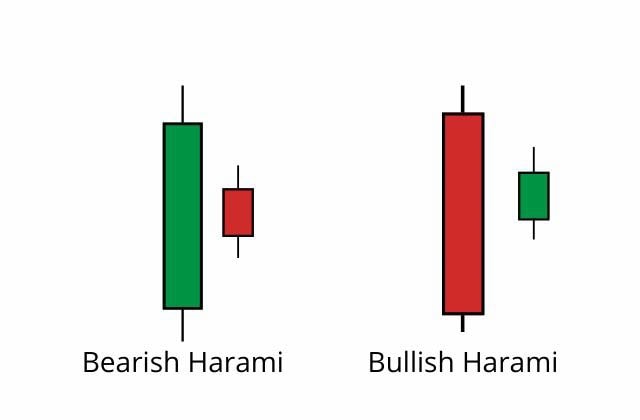
This pattern strongly suggests that the current situation will reverse. Let’s look at an example of what that might look like on a candlestick chart.
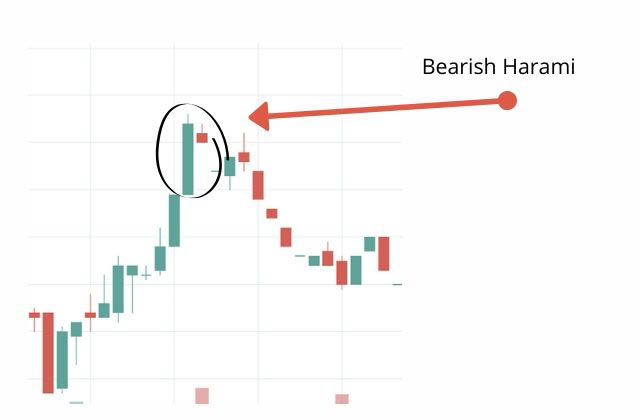
Here we see that the demand was higher than supply for a good streak. The buyers were winning. Then once it reached a certain price, the next opening price was lower and the closing price decreased from there. This is a strong indicator that there is going to be a trend reversal and the stock is going to change direction. This tells us that once the stock reached a certain price, it got exhausted and sellers were able to take over the market.
Engulfing Bullish and Engulfing Bearish
This pattern is where a small candlestick is followed by a larger opposite candlestick that fully engulfs the first one.

Here is an example of an engulfing bearish pattern.

We see that the buyers are buying the driving the price up for some time. Then at the peak, a large red candlestick engulfs the small green candlestick- signaling a trend reversal. This is a strong signal because it tells us that the sellers are overpowering the buyers- and by a lot since it completely engulfs the previous candle.
Are these all the Candlesticks to Know?
There are many more candlesticks that have names attached to them but they are not as important. If you spent all of your time memorizing candlestick names and all of the different types, then you would be missing the point.
The goal here is not name memorization. It is about understanding how certain candles can potentially predict behavior when placed in a pattern.

Read more articles about finance.

Read more articles about business.

8 Effective Ways to Market Your App in 2025
The app market continues to grow with spectacular figures, and more than ever, you must have an effective marketing plan. While millions of apps are listed in app stores, you must be visible. Knowing your target audience and their pain point can help you create a...

How Gravitec is Revolutionizing Web Push Notifications for Businesses
In the fast-paced digital landscape, businesses are constantly looking for innovative ways to engage and retain their audiences. Traditional marketing channels such as email and social media are saturated, making it harder to capture user attention. Push...

9 Game-Changing Strategies to Skyrocket Your SEO Performance
It’s no surprise that many businesses have started focusing on their online presence. That’s because the internet has created a new avenue for businesses to expand their reach and find new audiences. However, finding these results isn’t easy, especially for businesses...

How to Choose the Perfect Custom Exhibit Design for Your Brand
Do you want to create strong memories at your upcoming trade show display? A custom exhibit design works best when it builds a brand experience that showcases your brand identity while keeping visitors truly engaged. Recent trade show statistics reveal a 15%...

Boosting Brand Visibility with Custom Screenprinted Merchandise
Is your brand struggling to distinguish itself from competitors? Brands face unprecedented challenges to gain attention in today's saturated marketplace. Successful businesses are increasing their visibility through a proven strategy that companies have found...

Innovative Video Production Techniques for Los Angeles Businesses
Are you ready to produce remarkable video content that will differentiate your Los Angeles business from others? Businesses must use video production today to connect with their audience and differentiate themselves from competitors. The Movie & Video Production...

The Must-Dos for Brands Planning to Penetrate European Markets
Entering European markets offers considerable opportunities for brands seeking to expand their reach and drive growth, particularly through effective business strategies and understanding regulatory environments. This article examines the primary benefits of...

How Lawyers Can Employ Marketers to Get More Clients
Newly, the world has become highly sensitive with the legal profession across the globe having many lawyers demanding similar clients. Essential in today’s market should, therefore, be marketing and establishing a unique image for the lawyer so that whenever a...

Global Talent, Local Solutions: Connecting Businesses with the Right Workforce
In today's rapidly evolving economy, businesses face increasing challenges in finding the right talent to meet their specific needs. Companies must navigate shifting industry demands, evolving skill requirements, and the growing preference for flexible work...

How to Generate Land Clearing Leads and Grow Your Business
With a contracting business, there are a lot of things to balance. That’s especially true when it comes to land clearing. Generating leads can be a difficult process. Today, we’re going to explore some methods of doing so. Essentially, it’s going to come down to...

Optimizing Utility Costs: A Guide for Small Businesses
For small businesses, every penny saved can make a significant difference in overall profitability. With the rising cost of utilities, finding effective ways to manage and reduce energy expenses has become a crucial part of maintaining a healthy bottom line. ...

Why Top Platforms Are Crucial for Business Email Marketing
Marketing via email continues to dominate the world of marketing online and provides businesses with an unbeatable return on investment and access to their customers. However, the secret to unlocking its full potential is in the software that you choose. A good...
0 Comments