Have you ever wondered what truly happens when a visitor lands on your website? What catches their eye first? Where do they click? How far do they scroll before losing interest?

You don’t have to guess! You can use heatmaps.
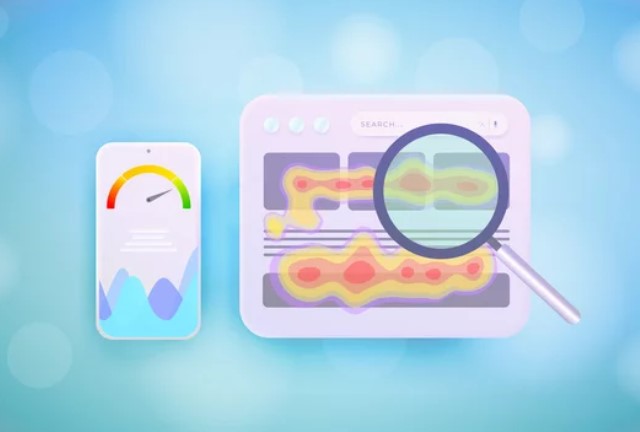
Heatmaps provide a visual representation of these behaviors, showing where users interact most on your site through varying colors. It provides a top view of user engagement, revealing which areas garner attention and those that remain ignored.
Heatmaps? What?
Have you seen a movie or played a video game in which the protagonist wears thermal goggles and you can see what they see? Heatmaps look similar to that. They are a colorful (literally) representation of what areas have heavy clicks, hovers, and activity (hot, usually orange to red) and what does not have any activity (cold, blue to white).
Heatmaps are very useful! They reveal user habits and preferences, as well as areas of confusion on your website. This shows which parts of your site are working and which need improvement (or removal).
There are several types of heatmaps you can use to analyze user behavior on your website:
- Click Heatmaps. Show where users click the most. This helps you understand what attracts users’ attention.
- Scroll Heatmaps. These display how far down the page users scroll. This type of heatmap indicates if your content is effectively engaging visitors.
- Mouse Movement Heatmaps. Track where users move their mouse. Users usually use their mouse as a pointer when reading or to hover over areas of interest.
- Attention Heatmaps. Highlight areas that get the most attention based on a combination of clicks and mouse movements.
Each type offers unique insights that, when combined, lead to a holistic understanding of user behavior.
Ready to utilize heatmaps to optimize your website conversions? Here are the steps.
Step 1: Determine Why You Want To Use a Heatmap
The first step in effectively utilizing heatmaps is to decide why you want to use them. Here are some of the common reasons why:
To Identify Problem Areas on Your Pages
Heatmaps can help you spot trouble spots on your website that might be confusing for users. For instance, if one of your pages isn’t getting much engagement, heatmaps can show you where users are (or aren’t) clicking and how long they’re staying interested.
Using this data, you can tweak the position, color, or size of elements in your content to make them more user-friendly.
To Improve User Experience
Furthermore, heatmaps provide insights into how users interact with your site. This way, you can make adjustments to enhance the overall user experience.
Whether it’s redesigning certain elements, improving navigation, or simplifying the layout, a better user experience can lead to happier visitors and higher conversion rates.
To Find Ways to Optimize Content Placement
Heatmaps reveal which parts of your content are grabbing the most (or the least) attention. For instance, if readers rarely notice the bottom of your articles, consider relocating your CTAs to a more prominent location, such as before the article or right next to it, to enhance their visibility.
By strategically placing important content where it’s most likely to be seen, you can guide users towards the actions you want them to take.
Step 2: Implement Your Heatmap
Adding heatmaps to your website is easier than you think!
Choose a Heatmap Tool
There are several heatmap tools available. These heatmap services usually have free plans or trials, so there is very little risk if you are a small business with a tiny marketing budget.
- Hotjar
- Crazy Egg
- Mouseflow
Set Up Your Account
Sign up for an account. Once you have a free account, they will guide you through the process of integrating their tool into your website. This usually involves adding a small snippet of code that your audience does not see. Once installed, the tool will start collecting data on how visitors interact with your site.
Let it Do Its Thing
After setting up the heatmap tool, sit back, relax, and give it a week or two to gather significant data.
Step 3: Analyzing Heatmap Data and Implement Changes
When you get significant data, it is time to take action. Look for patterns and trends that can provide insights into how users interact with your site.
Here are a few tips to get you started:
Look for High-Click Areas and Take Advantage
These are typically red or orange on the heat map. These are the spots where users are most engaged. Ensure that these areas include important elements like CTAs, sign-up forms, or key information.
Identify Cold Spots That Need Fixing
Cold spots are areas with little to no user interaction. If these sections have CTAs or significant information, you should consider improving their engagement.
Sometimes all it takes to encourage interaction is altering a button’s color, size, or wording. Or, alternatively, you can just move them to a hot spot.
Compare Different Pages From Your Site
Use heatmaps to compare customer behavior across different pages on your website. This can give you an idea of which pages are performing well and which ones need improvement. It’s also useful for understanding how different layouts or content resonate with your audience.
Track Your Changes Over Time
To track changes in user behavior over time, regularly monitor your heatmap data. This helps to measure the impact of website changes. Adjust your strategy when needed!
More Practical Tips for Using Heatmaps
Here are some practical tips to help you effectively use heatmaps to increase your website’s conversions:
Prioritize High-Impact Areas
It could be tempting to fix everything, but remember the Pareto Principle: 90% of outcomes come from 10% of action.
Focus on areas that affect user experience and conversions the most. This could be your homepage, product pages, or landing pages. These pages are often the first impression users have of your site and play a crucial role in their journey towards conversion.
Use A/B Tests with Heatmaps
Want to ramp it up a bit? Before making any changes, test your new designs as variations in A/B testing tools.
A/B tools allow you to test drive your design improvements by serving both the original (called control) and the variations to your traffic. Once you compare and decide on a winner, implement it fully.
Continuously refine your website based on user behavior, and you will create a more engaging and effective user experience.
Incorporate User Feedback
Don’t rely solely on heat maps. Combine your findings with user feedback to get a well-rounded understanding of the user experience. Use surveys and social media posts to generate such feedback.
If All Else Fails, Seek Professional Input
If you’re finding it challenging to interpret heatmap data or to implement changes effectively, consider seeking help from a conversion rate optimization agency. A CRO agency specializes in analyzing user behavior, running A/B tests, and making data-driven recommendations to enhance your website’s performance.
Conclusion
Using heatmaps is a game-changer when it comes to understanding user behavior and optimizing your website for conversions. So go ahead, choose a heatmap tool, and start analyzing. Happy optimizing!


0 Comments