How to check Website Traffic & Statistics using Google Analytics
Are you curious about how many people visit your website? How about the pages that they visit? 
Using Google Analytics to Check Website Traffic
Google Analytics is a powerful tool that can provide you with all the data you could ever need concerning your website. And the best part is that it is completely FREE. I know it can be daunting when talking about installing code to your website, but this guide will walk you through the process for sites hosted on popular website builders. If you have already set up Google Analytics on your website, skip down to step 2. Or if you are familiar with the platform, check out these four essential website statistics for understanding your target audience.
Step 1: Create a Google Analytics account.
- Go to the Google Analytics home page and click “Sign Up”
- Enter all relevant details including website URL and Account Name and click “Get Tracking ID”.
- Accept the Google Analytics Terms of Service Agreement.
From here, you will be taken to the administrator section of your new Google Analytics setup. You will be presented with a new Tracking ID number and some code below that. With most popular website builders, you will only need this tracking ID and you will not have to worry about any coding on your website. The next step is entirely dependent on the platform your website is on. Here are some helpful guides for the most popular website management systems.
- Install Google Analytics on WordPress using the Simple Universal Google Analytics plugin
- Install Google Analytics on Squarespace
- Install Google Analytics on Wix
- Install Google Analytics on GoDaddy Website Builder
Once you have installed Google Analytics, it is time to start looking at some metrics. Otherwise, you can have a digital marketing expert connect Google Analytics to your business website within 24 hours.
Step 2: Understanding Important Website Traffic Statistics
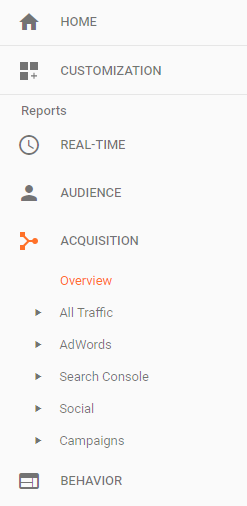
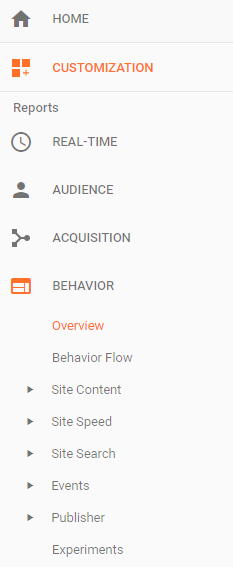
Once you are logged in to the analytics, you will notice five tabs under Reports. 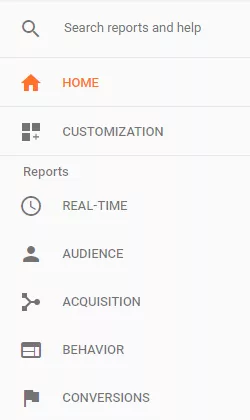
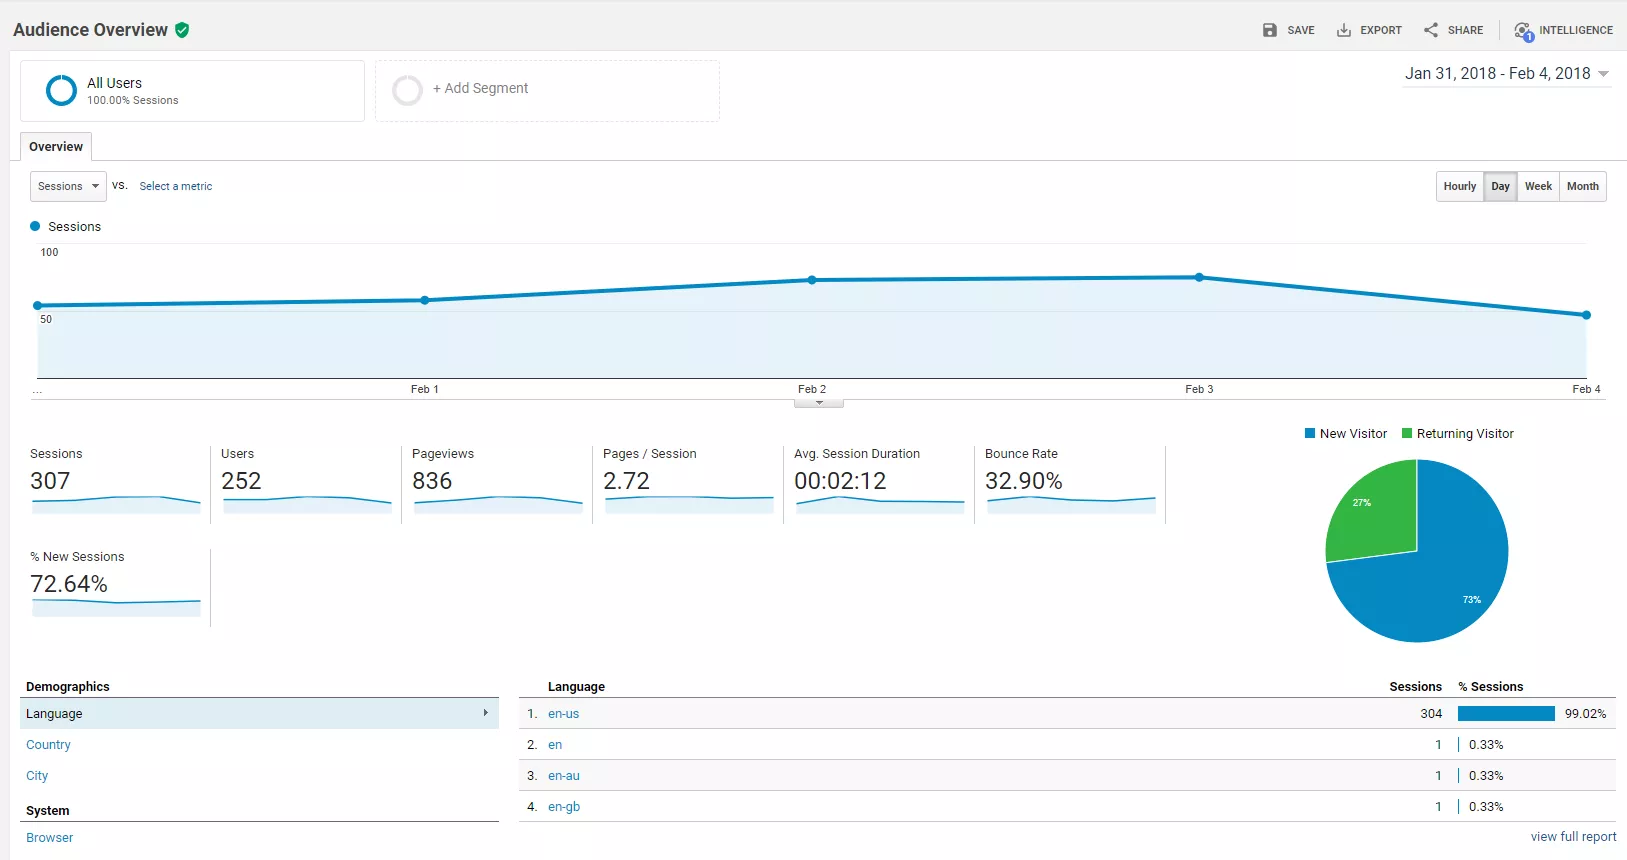
Check Website Traffic with Google Analytics Audience Tab
This tab has some key statistics to understand how people use your website. Let’s look at what each of these metrics means to you.
- Sessions
- This is simply the number of times any user is actively engaged with your website.
- Users
- The number of users to your site. This is different than sessions since a user can engage with your website multiple times within a given date range.
- Pageviews
- This is the number of times a page has been viewed on your site.
- Pages / Sessions
- The average amount of pages a user engages with per session.
- Sessions Duration
- This is the average amount of time a user spends on your website between all pages.
- Bounce Rate
- The bounce rate is an indicator if people are engaging with your content. This is the percentage of users who did not interact with a page upon a visit.
- % New Sessions
- This is simply the percentage of new users vs. returning users to your site.
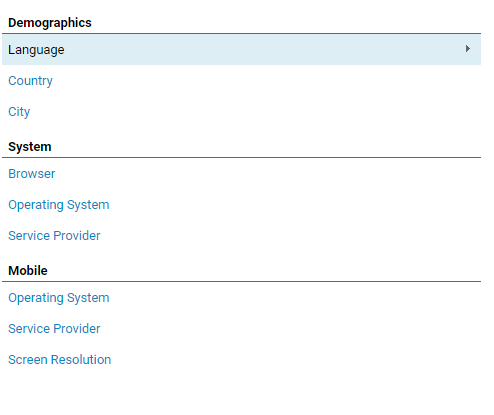
Underneath those metrics are some additional options to see your users’ demographics, systems, and mobile device usage.
Demographics Data
The demographics section can show you exactly where your users are coming in from and this can target down to a country, state, or even a user’s city.
Systems Statistics
While the systems tab showing the user’s browser may not seem important, it could possibly lead to understanding website issues. For example, if you have a bounce rate of 30% on the Chrome web browser and a bounce rate of 70% on Safari, that might lead you to believe that the website might not show correctly on that browser. By now, I am sure that you have noticed the large number of sections to explore the “Audience” tab. While many of these options can provide valuable data, we are going to cover a few of the simple components that are helpful and easy to understand.
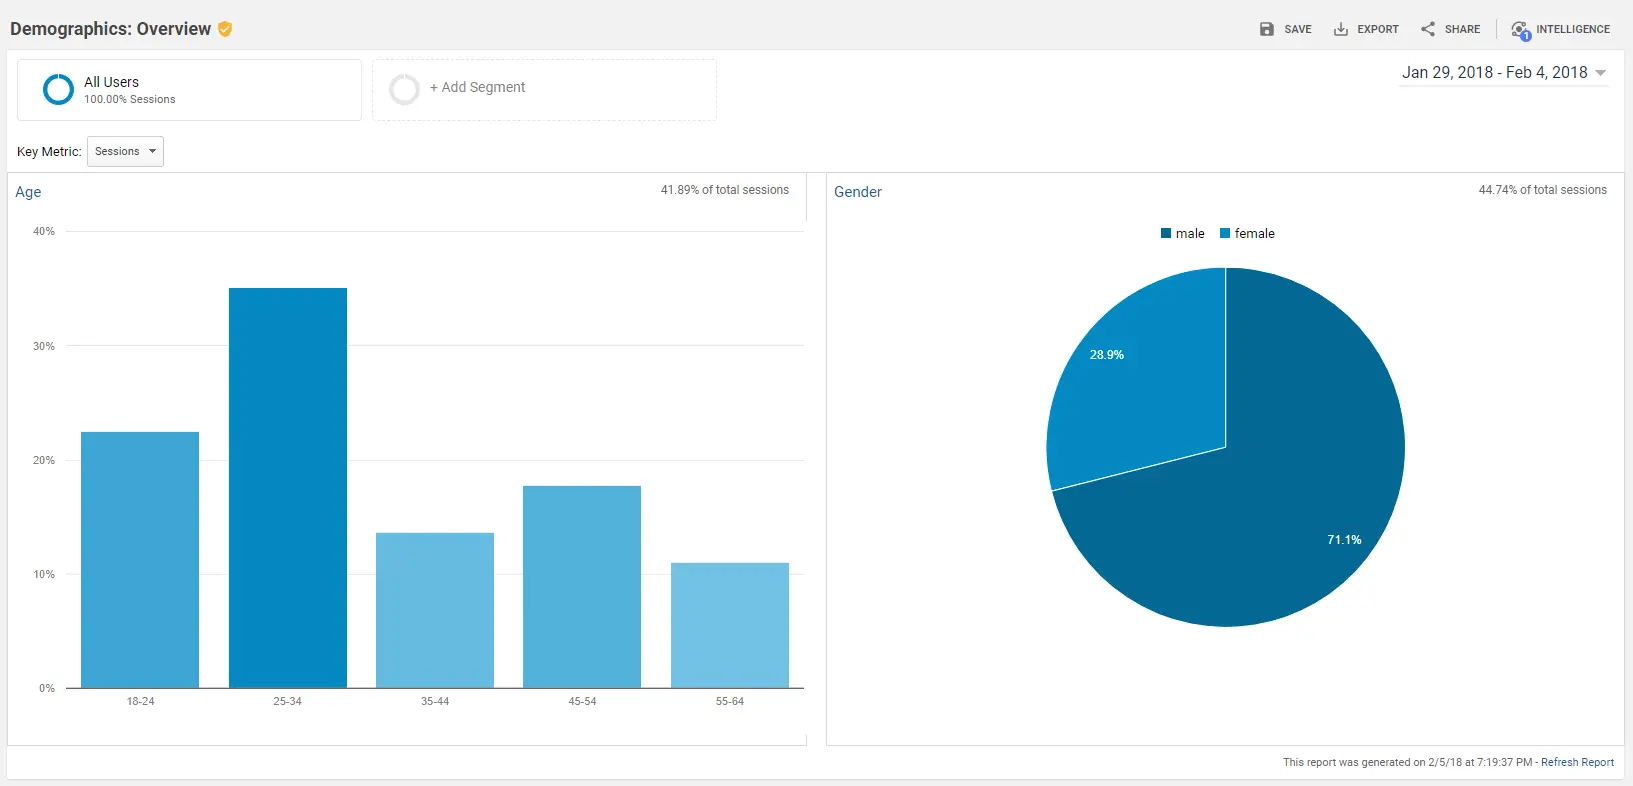
Demographics Overview
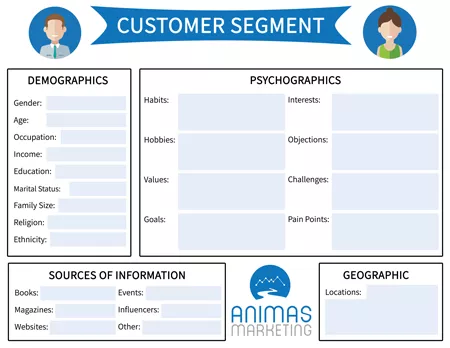
With the demographics secondary tab, we can see an overview of age and gender of your website users. This is incredibly helpful in understanding your consumer segments that can build your marketing efforts.
Mobile Statistic Overview
This section will show you how many people access your website on a mobile device vs. a desktop computer or tablet. 
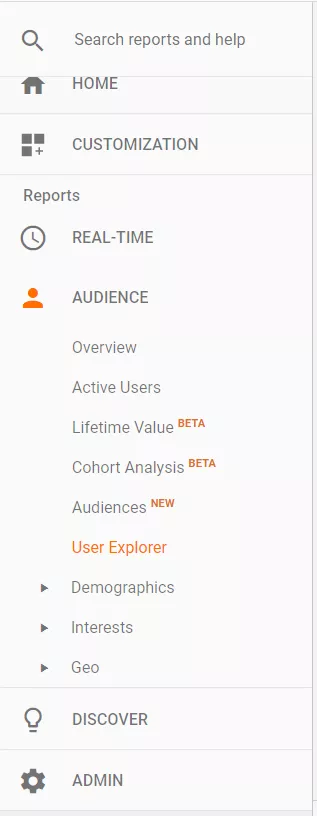
- Active Users
- Lifetime Value
- Cohort Analysis
- Audiences
- User Explorer
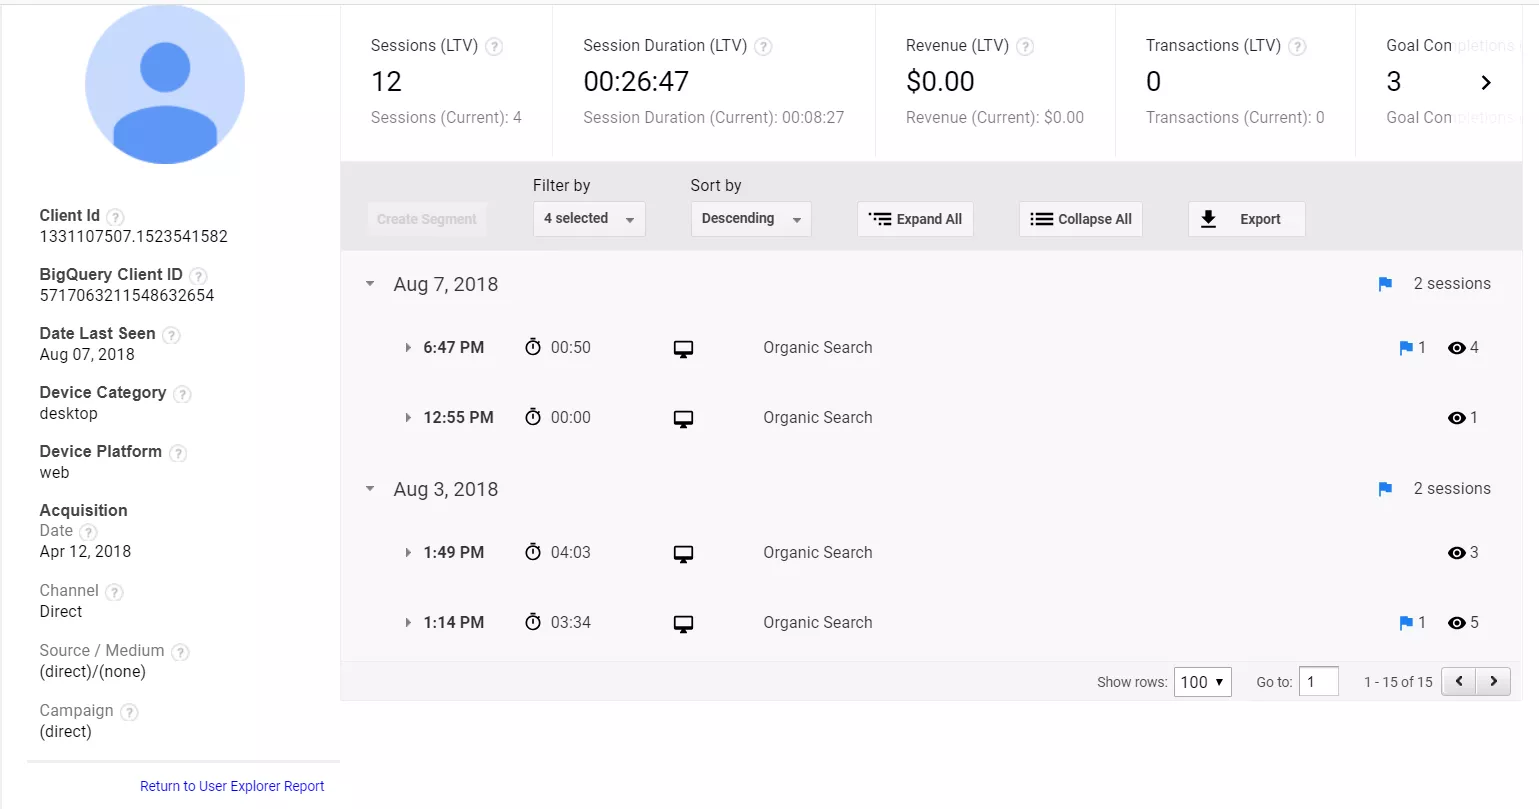
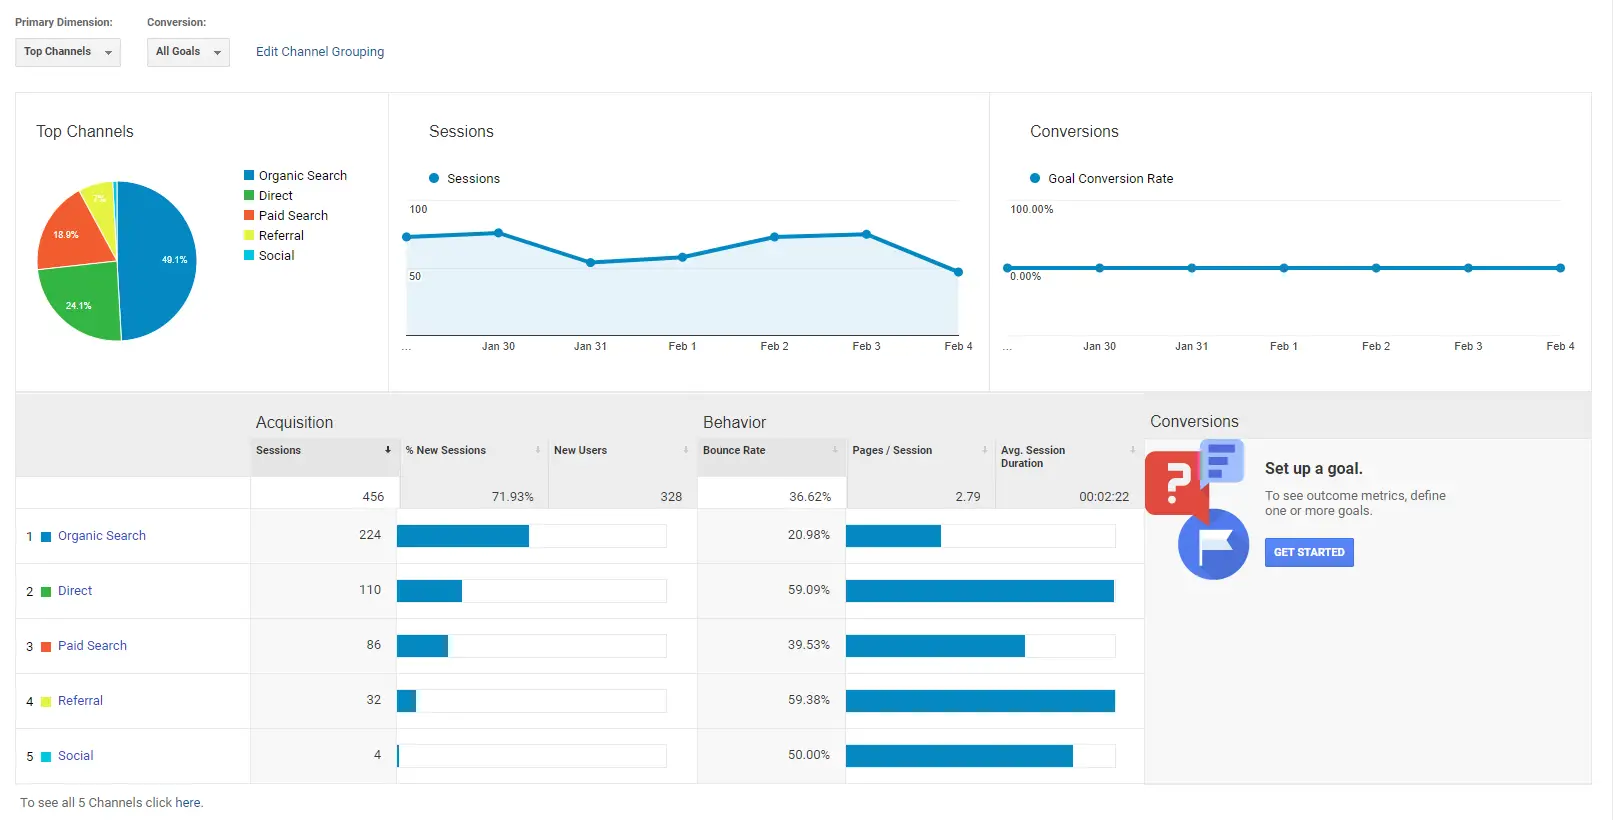
- Direct
- This is when a user is searching for your brand directly.
- Organic Search
- This is when a user comes to your website through the organic results of a search engine. This is built on the authority and trust of your webpage and is the key element for search engine optimization.
- Referral
- This is the number of users who arrive at your site through other web pages on the internet.
- Social
- The number of users who are sent to your website through social media channels.
Behavior Statistics
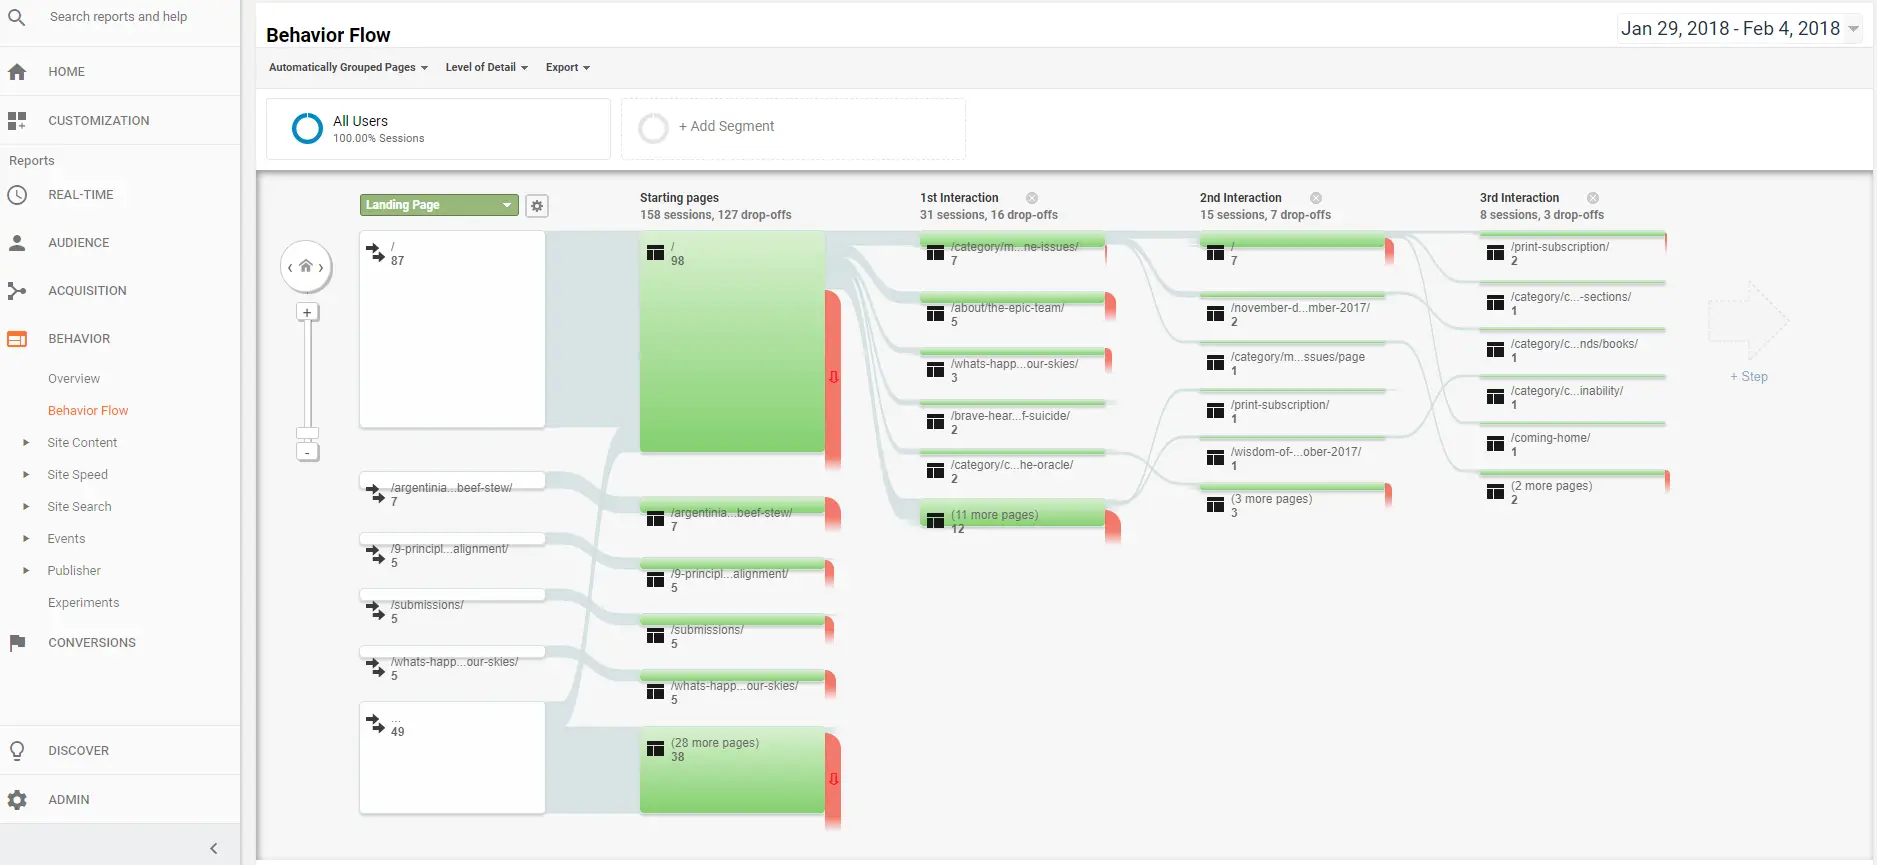
The data that we find most helpful in this section is under “Behavior Flow” The Behavior Flow tab shows the customer journey for your users from where they begin on your website until they leave. These statistics clarify which pages on your site are helpful for users and when people are deciding to leave your site. This allows you to optimize your pages for better customer interaction.
You can also use the power of Google Analytics with other third-party reporting interfaces to build robust charts and analytics.
For example, with Sitechecker, you can check the traffic on your site in a few seconds. The tool also provides the ability to integrate Google Analytics, and you can use Sitechecker to track traffic on your site and not only.
This guide should give you a great start to understanding some of the best statistics to know for your website. While there is much to learn about Google Analytics, these tips will help your business in optimizing your pages and creating stronger customer segments and a better customer journey on your website.
Need Help Installing Google Analytics?
We can help install Google Analytics within 24 hours so you can focus on the important metrics for your business.
Read more articles about marketing.
9 Game-Changing Strategies to Skyrocket Your SEO Performance
It’s no surprise that many businesses have started focusing on their online presence. That’s because the internet has created a new avenue for businesses to expand their reach and find new audiences. However, finding these results isn’t easy, especially for businesses...
The Must-Dos for Brands Planning to Penetrate European Markets
Entering European markets offers considerable opportunities for brands seeking to expand their reach and drive growth, particularly through effective business strategies and understanding regulatory environments. This article examines the primary benefits of...
How to Choose the Perfect Custom Exhibit Design for Your Brand
Do you want to create strong memories at your upcoming trade show display? A custom exhibit design works best when it builds a brand experience that showcases your brand identity while keeping visitors truly engaged. Recent trade show statistics reveal a 15%...
How Lawyers Can Employ Marketers to Get More Clients
Newly, the world has become highly sensitive with the legal profession across the globe having many lawyers demanding similar clients. Essential in today’s market should, therefore, be marketing and establishing a unique image for the lawyer so that whenever a...
Why Top Platforms Are Crucial for Business Email Marketing
Marketing via email continues to dominate the world of marketing online and provides businesses with an unbeatable return on investment and access to their customers. However, the secret to unlocking its full potential is in the software that you choose. A good...
How Digital Marketing Services Improve Lead Generation for B2B Companies
With growing interconnectivity, digital marketing services have emerged as a key influence to growth particularly in B2B markets. Outbound lead generation has evolved significantly from cold calling and direct mail campaigns and has embraced more contemporary and...





0 Comments