
How to check Website Traffic & Statistics using Google Analytics
![]()
Are you curious about how many people visit your website? How about the pages that they visit?  Or perhaps… you simply want to find out where your website visitors are coming from. Luckily, there is a free solution for all this information and that is using Google Analytics.
Using Google Analytics to Check Website Traffic
Google Analytics is a powerful tool that can provide you with all the data you could ever need concerning your website. And the best part is that it is completely FREE. I know it can be daunting when talking about installing code to your website, but this guide will walk you through the process for sites hosted on popular website builders. If you have already set up Google Analytics on your website, skip down to step 2. Or if you are familiar with the platform, check out these four essential website statistics for understanding your target audience.
Step 1: Create a Google Analytics account.
- Go to the Google Analytics home page and click “Sign Up”
- Enter all relevant details including website URL and Account Name and click “Get Tracking ID”.
- Accept the Google Analytics Terms of Service Agreement.
From here, you will be taken to the administrator section of your new Google Analytics setup. You will be presented with a new Tracking ID number and some code below that. ![]() With most popular website builders, you will only need this tracking ID and you will not have to worry about any coding on your website. The next step is entirely dependent on the platform your website is on. Here are some helpful guides for the most popular website management systems.
With most popular website builders, you will only need this tracking ID and you will not have to worry about any coding on your website. The next step is entirely dependent on the platform your website is on. Here are some helpful guides for the most popular website management systems.
- Install Google Analytics on WordPress using the Simple Universal Google Analytics plugin
- Install Google Analytics on Squarespace
- Install Google Analytics on Wix
- Install Google Analytics on GoDaddy Website Builder
Once you have installed Google Analytics, it is time to start looking at some metrics. Otherwise, you can have a digital marketing expert connect Google Analytics to your business website within 24 hours.
Step 2: Understanding Important Website Traffic Statistics
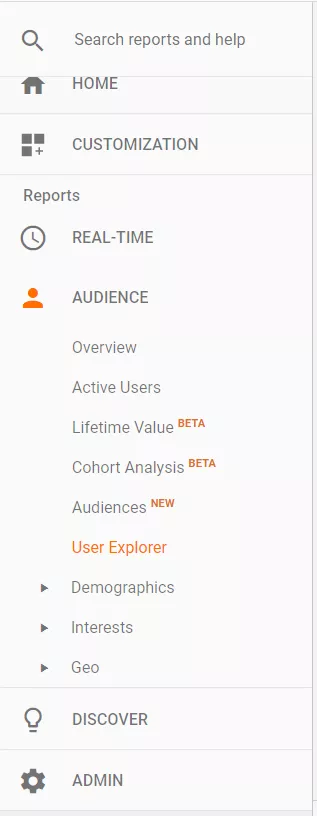
Once you are logged in to the analytics, you will notice five tabs under Reports. 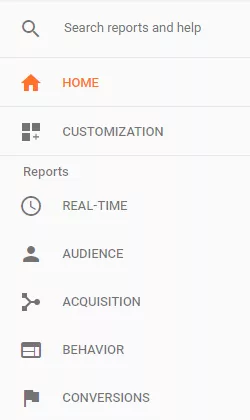 The first tab, “Real-Time”, will allow you to see any active users currently on your website at the current moment. With the additional options, you can see where these users are located, where they came from, and the content they are viewing. Moving to the “Audience” tab, we can see an extensive amount of simple data for a date range of your choosing.
 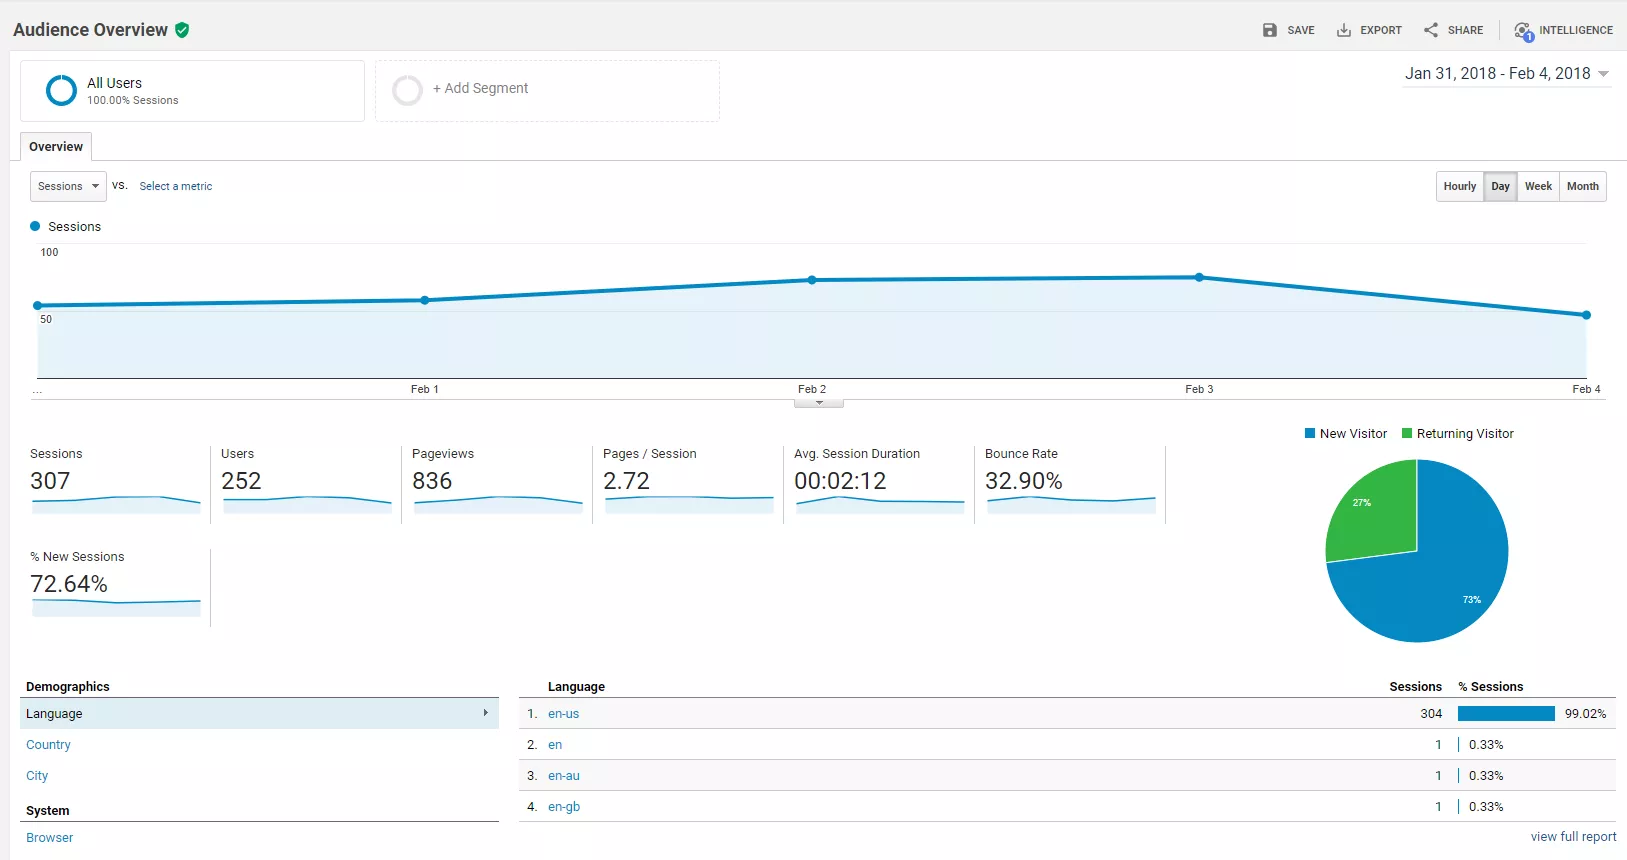 Begin by choosing your date range in the top-right corner and click “Apply”. For this example, we choose to see the metrics for a week.
Check Website Traffic with Google Analytics Audience Tab
This tab has some key statistics to understand how people use your website. Let’s look at what each of these metrics means to you.
- Sessions
- This is simply the number of times any user is actively engaged with your website.
- Users
- The number of users to your site. This is different than sessions since a user can engage with your website multiple times within a given date range.
- Pageviews
- This is the number of times a page has been viewed on your site.
- Pages / Sessions
- The average amount of pages a user engages with per session.
- Sessions Duration
- This is the average amount of time a user spends on your website between all pages.
- Bounce Rate
- The bounce rate is an indicator if people are engaging with your content. This is the percentage of users who did not interact with a page upon a visit.
- % New Sessions
- This is simply the percentage of new users vs. returning users to your site.
Underneath those metrics are some additional options to see your users’ demographics, systems, and mobile device usage.
Demographics Data
The demographics section can show you exactly where your users are coming in from and this can target down to a country, state, or even a user’s city. 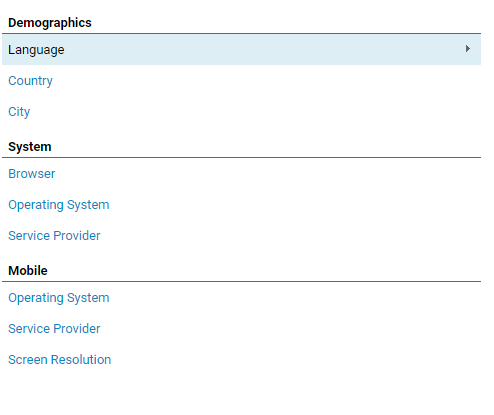
Systems Statistics
While the systems tab showing the user’s browser may not seem important, it could possibly lead to understanding website issues. For example, if you have a bounce rate of 30% on the Chrome web browser and a bounce rate of 70% on Safari, that might lead you to believe that the website might not show correctly on that browser. By now, I am sure that you have noticed the large number of sections to explore the “Audience” tab. While many of these options can provide valuable data, we are going to cover a few of the simple components that are helpful and easy to understand.
Demographics Overview
With the demographics secondary tab, we can see an overview of age and gender of your website users. This is incredibly helpful in understanding your consumer segments that can build your marketing efforts. 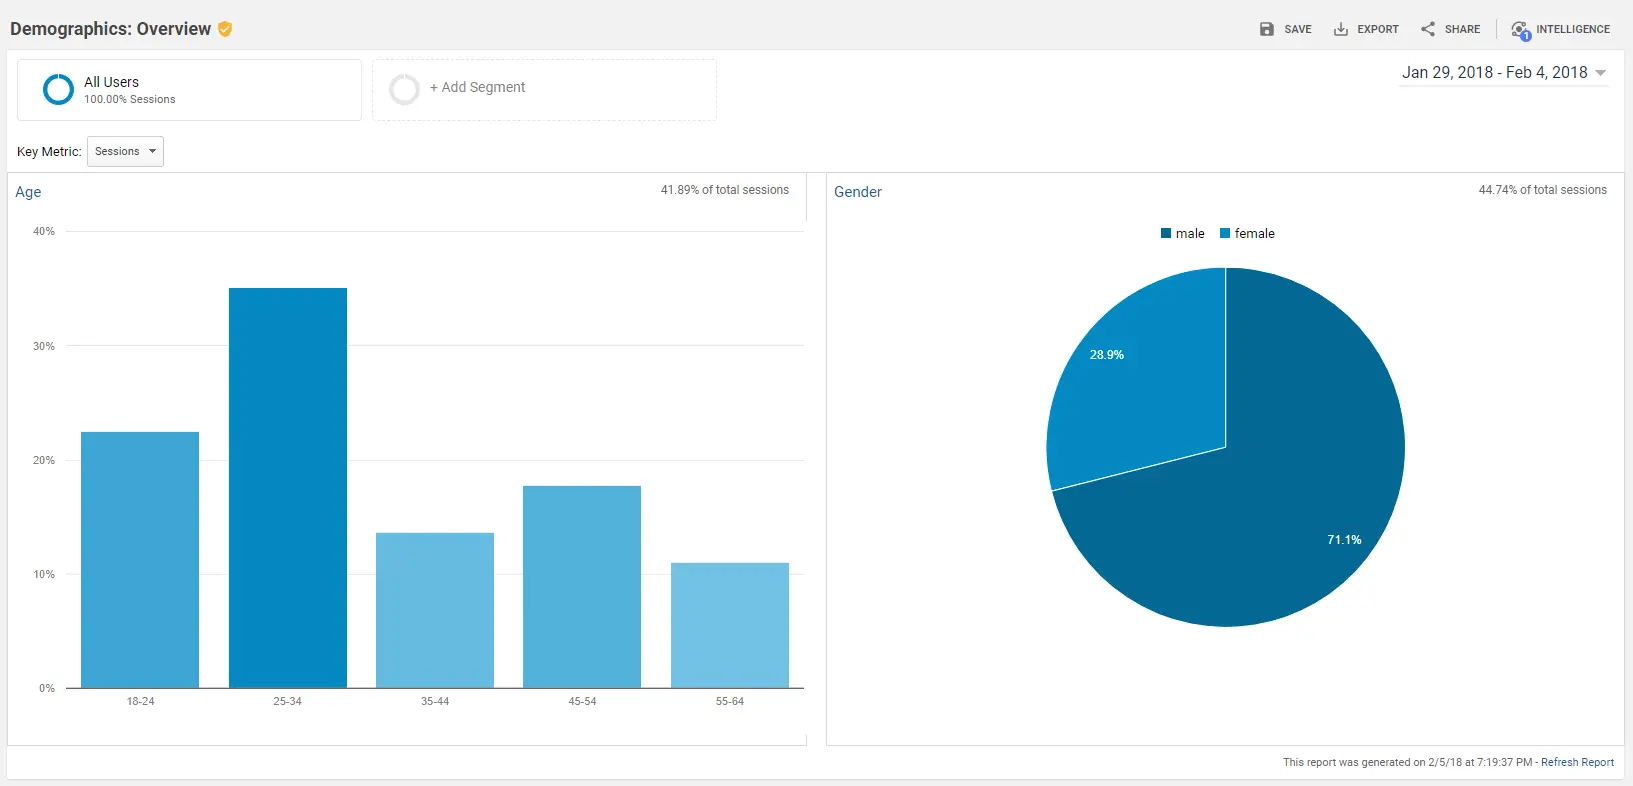
Mobile Statistic Overview
This section will show you how many people access your website on a mobile device vs. a desktop computer or tablet. 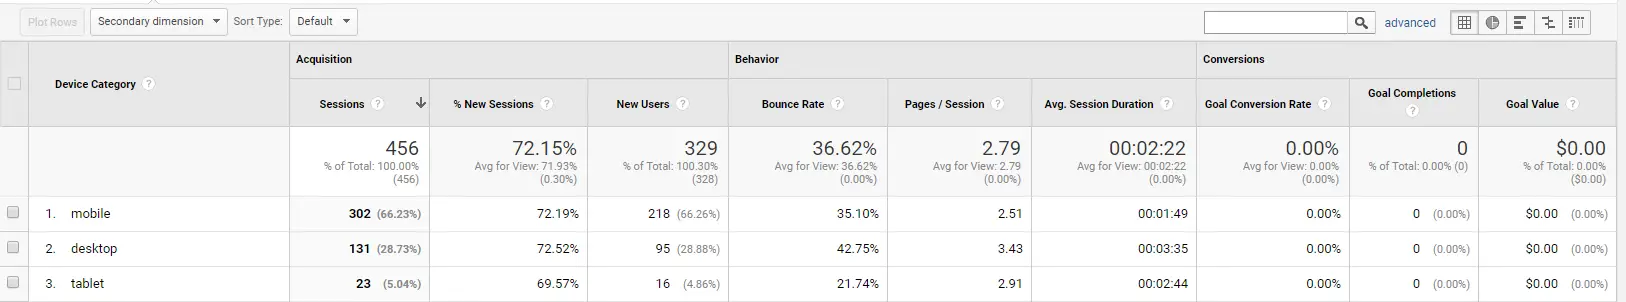 This will better help in understanding how users are searching for your site and optimizing your content for those viewers. Now that we have covered the “Overview” section of the Audience Reporting tab, let’s take a look at some of the other sub-menu items before moving to the “Acquisition Tab” The first sub-menu items include:
- Active Users
- Lifetime Value
- Cohort Analysis
- Audiences
- User Explorer
 Let’s stop and take a look at what the “User Explorer” sub menu tells us as small business owners. This section shows us the exact behavior of each individual user on the website. This can include the country, IP Address, behavior flow, time spent at each point of the site, and much more. Why is this important? This is extremely useful in being able to determine how and why people act the way they do on your website. For example, you may notice that many users are finding your website through organic search results but leave quickly. Then you see that it is common for those same people to visit a week later through a social media channel but spend more time on the site. This may tell you that you could imporve upon the user experience from being found on organic search results. The “user explorer” screen looks like this:
 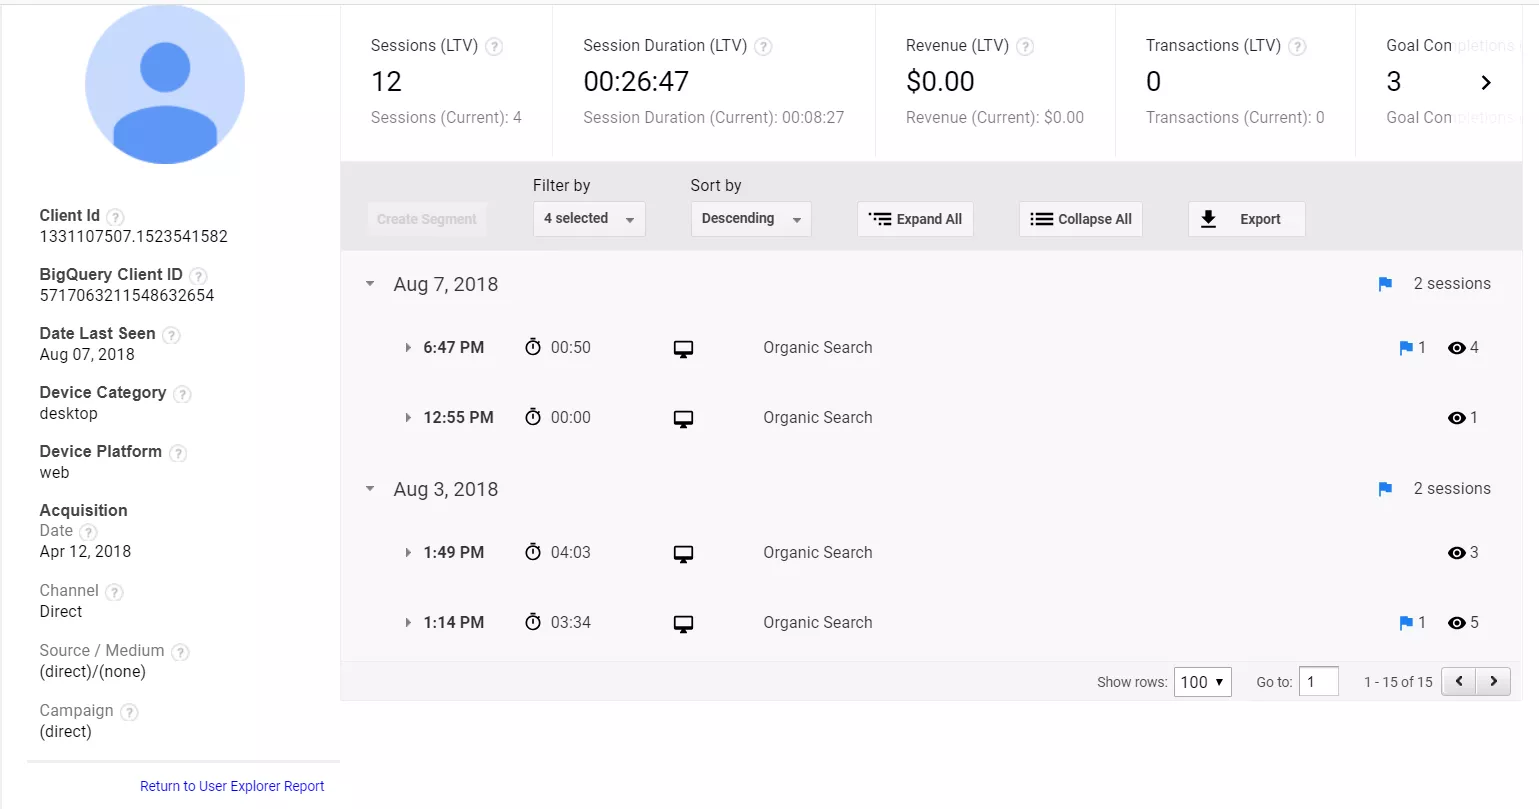 Take note of how this particular user came back to the website four times within the week and the time spent at each visit. Now, let’s go back to our main five sections and look at the “Acquisition Tab”.
 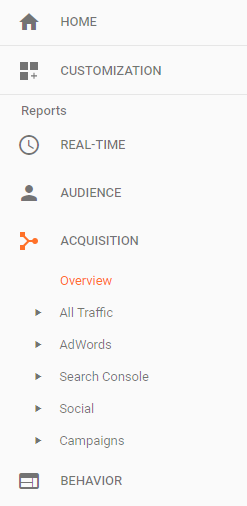 When selecting the “Overview” subtab, we gain the statistics involved with how people are arriving at your website. Let’s explain these options in detail.
- Direct
- This is when a user is searching for your brand directly.
- Organic Search
- This is when a user comes to your website through the organic results of a search engine. This is built on the authority and trust of your webpage and is the key element for search engine optimization.
- Referral
- This is the number of users who arrive at your site through other web pages on the internet.
- Social
- The number of users who are sent to your website through social media channels.
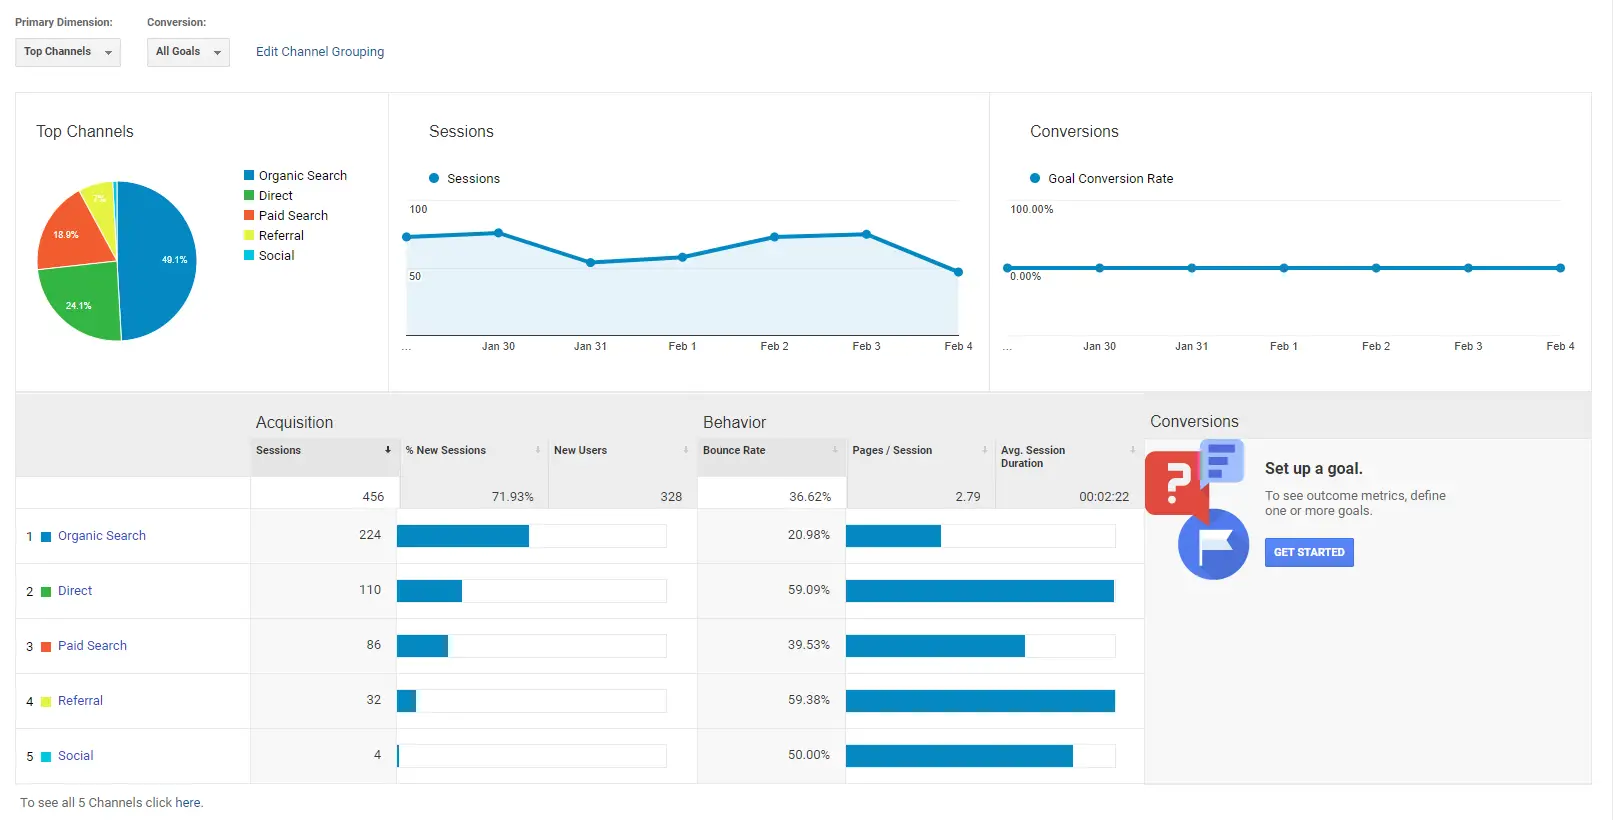 This data is extremely helpful in understanding where you acquire your visitor and how to best optimize for certain channels. For example, if the website’s organic search is low compared to other metrics, then it might be wise to investigate options for optimizing your website or hire a professional SEO agency to build your rankings. Stepping back to the main five categories, let’s look at an essential element of the “Behavior” tab.
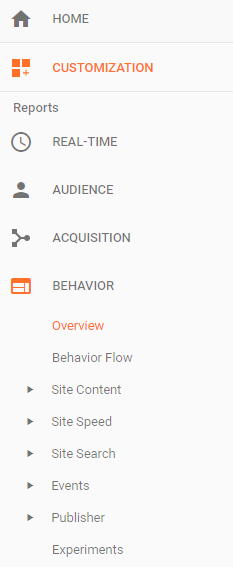
Behavior Statistics
The data that we find most helpful in this section is under “Behavior Flow” The Behavior Flow tab shows the customer journey for your users from where they begin on your website until they leave. These statistics clarify which pages on your site are helpful for users and when people are deciding to leave your site. This allows you to optimize your pages for better customer interaction. 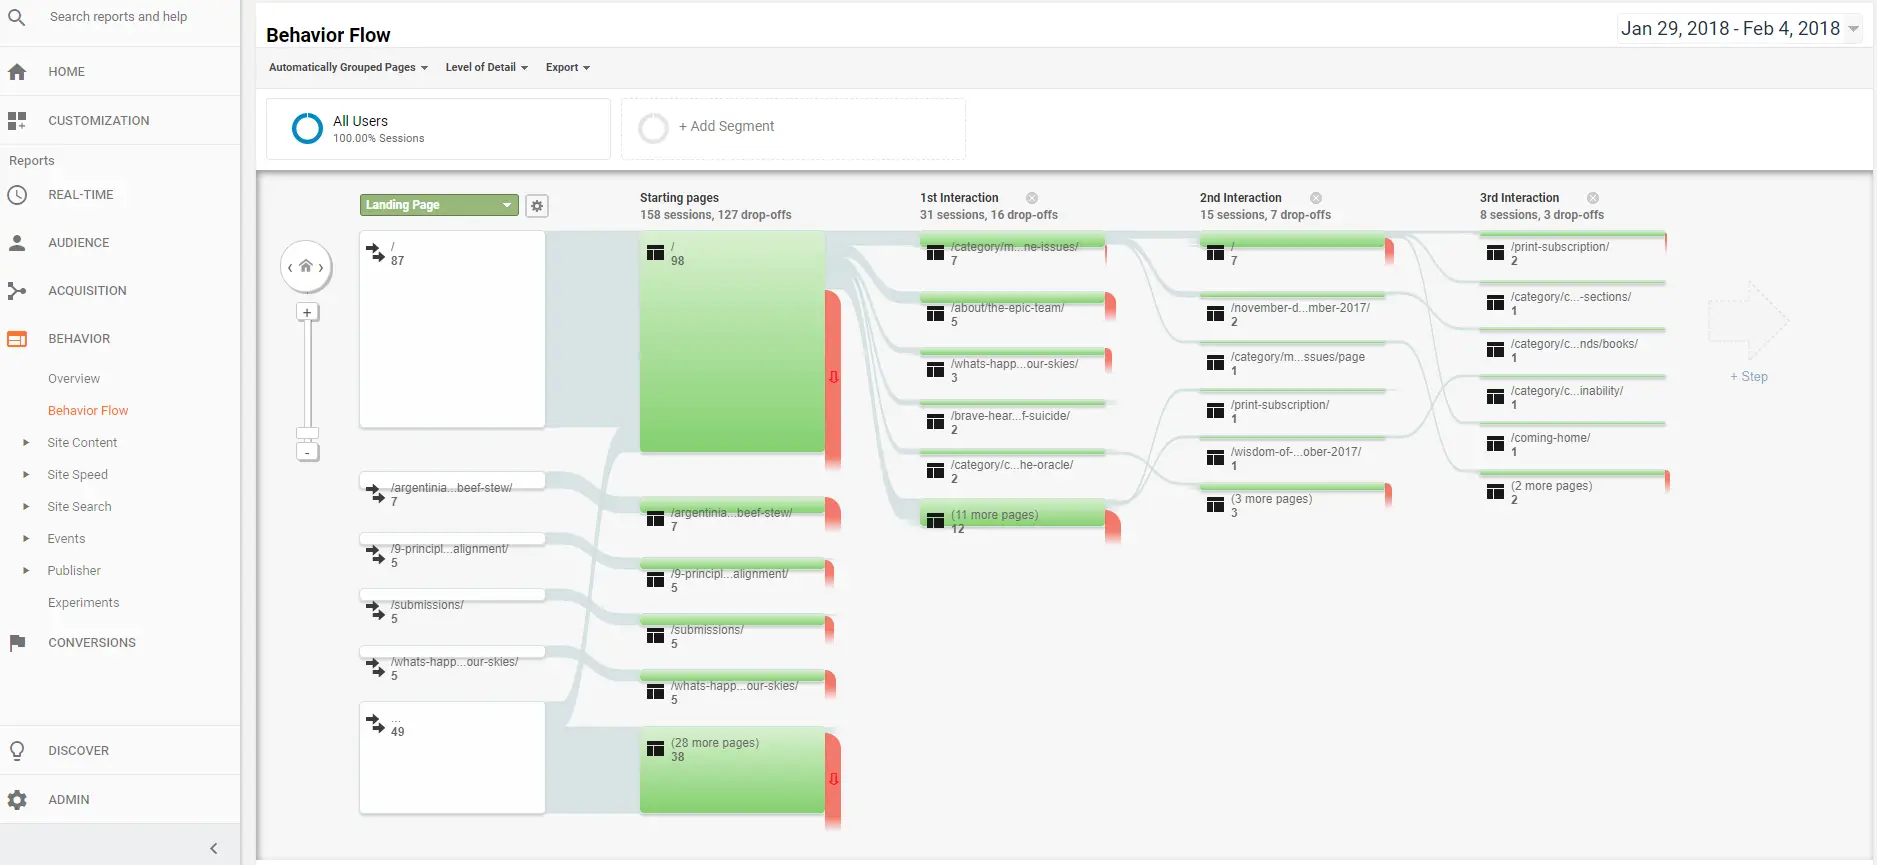
You can also use the power of Google Analytics with other third-party reporting interfaces to build robust charts and analytics.
For example, with Sitechecker, you can check the traffic on your site in a few seconds. The tool also provides the ability to integrate Google Analytics, and you can use Sitechecker to track traffic on your site and not only.
This guide should give you a great start to understanding some of the best statistics to know for your website. While there is much to learn about Google Analytics, these tips will help your business in optimizing your pages and creating stronger customer segments and a better customer journey on your website.
Need Help Installing Google Analytics?
We can help install Google Analytics within 24 hours so you can focus on the important metrics for your business.

Try it now for free!


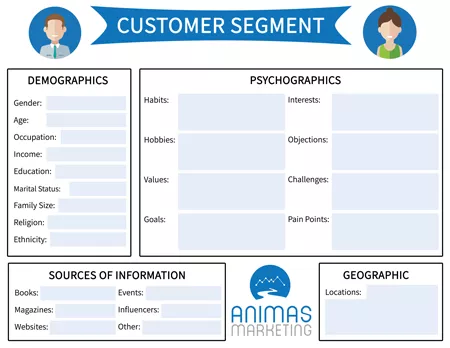
Bring in high-converting customers to your business with the customer segment template.
Need Marketing Help?
If you want assistance with marketing strategies to grow your business, then let's talk.
Read more articles about analytics.
Read more articles about marketing.

How 3PL Fulfillment Enhances Personalization In Digital Marketing
Digital marketing success often has effective personalization at its center: the customer must feel like you know who they are, know their pain points, and that your product or service speaks directly to them without mincing words. But achieving this...

Driving Business Growth with Digital Marketing and AI Innovations
In today’s fast-paced world, digital marketing is rapidly changing and evolving. The old ways of traditional marketing are long gone. Conventional marketing techniques are no longer enough to capture customer attention. As businesses strive to stay ahead...

Boost Your Marketing Efforts With Interactive Digital Business Cards
When you’re in the business world, you know that building a strong professional reputation is more critical than ever. A key component of this is establishing and maintaining meaningful connections. While traditional paper business cards have long been the go-to tool...

Dominating the Digital Landscape: A Comprehensive Guide to Law Firm Digital Marketing
Introduction In today's internet age, establishing an authoritative digital presence proves foundational for law firms attracting ideal prospective clients while continually engaging existing ones. Recognizing where to start building online visibility or choosing...

Unveiling the Power of Competitor Marketing: A Comprehensive Guide
Introduction In the world of business, no company operates in a vacuum. You likely have many competitors vying for the same customer attention and dollars that you seek for your brand. This places competitor intelligence at the heart of impactful marketing....

From Strategy to Execution: Inside the Dynamic Workflow of a Modern Marketing Agency
In the fast-paced world of marketing, success hinges on the seamless integration of strategy and execution. Modern marketing agencies operate at the intersection of creativity, technology, and strategy, orchestrating complex workflows to deliver impactful campaigns...
0 Comments